


By Ruining Zhu, Wendi Yang, Hui Wu, Sijie Yu
The outbreak of Corona Virus Disease (COVID-19) in 2020 has led the U.S. economy into rapid contraction. With the enforcement of social distancing, many businesses have shut down regular transactions. The impact on the U.S. labor market is pretty large, leading to a striking increase in the unemployment rate among different industries and populations. Out of three sectors of the economy – primary, secondary and tertiary- the tertiary sector has experienced the highest unemployment rate, where the Leisure & Hospitality Industry hitting its peak at 39.3% in April 2020, being one of the most affected U.S. industries (FRED).
It is essential to explore the employment situation for the formulation of monetary and fiscal policies that aim to alleviate the rise in the unemployment rate among different groups of industries, age, gender, race, and level of education. By showing how each group is affected by the pandemic, policymakers could give priority to those that need the most support. Furthermore, the analysis of which industries are being affected the most can enhance our understanding of the current economic situation and enable the government to make better financial decisions. Our main finding is that younger workers, women, minorities, and workers of lower levels of education have experienced the greatest increase in the unemployment rate during the epidemic. The different demographics of each industry also explain the unemployment rate difference between each industry.
In this report, we will use a Difference-in-Differences (DID) model to explore the impact of COVID-19 on the U.S. unemployment rate among various groups. Under the hypothesis that the unemployment rate of 2020 should be the same as that of 2019 if there is no COVID-19, we use the 2019 unemployment rate as our control group. The data used are mainly from Fred Reserve Economic Database. It contains detailed information on the unemployment rate of different industries, age, gender, race, and level of education.
Data and Model
The data used in the model were obtained from the Fred Reserve Economic Database (FRED), a widely reported database maintained by the Federal Reserve Bank of St. Louis. FRED provides monthly data ranging from January 2010 to January 2021, including the U.S. unemployment rate of different industries, ages, genders, racial ethnicities, and levels of education. In this research, we mainly discussed 3 industries: Agriculture, Manufacturing, and Leisure and Hospitality, which are representatives of the primary, secondary and tertiary sectors respectively. Individuals were divided into 2 gender groups: Male and Female; 3 age groups: 16-24, 25-54, and 55 years old and over; 4 racial groups: Black/African American, Hispanic/Latino American, White American, and Asian American; and 4 education levels: Less than High School Diploma, High School Graduates, Some College or Associated, Degree, and Bachelor’s Degree or Higher.
To test whether and how COVID-19 has influenced each group, we used a difference-in-differences (DID) model:

where yit is the unemployment rate under different dimensions, T equals 1 if post-intervention (time after lockdown which is after 3/14/2020) and equals 0 if it is pre-intervention (time before 3/14/2020), Di equals 1 if it is in the treatment group (in the year 2020) and equals 0 if it is in the control group (in the year 2019), and εit is the error term. β0 represents the average unemployment rate when there is no COVID-19, while β3 measures the effect of COVID-19 on the unemployment rate. In this model, it was assumed that there is no time trend before the intervention.
Results of Difference-In-Differences Model
Unemployment Rate by Industries
Figure 1 shows the unemployment rate among different industries. Before 2020, the unemployment rate decreased gradually and then became steady. When COVID-19 hit the U.S., the unemployment rate of Manufacturing and Leisure & Hospitality increased rapidly. Specifically, the unemployment rate of Leisure & Hospitality peaked at 39.3% in April 2020. In late 2020, even though the rate dropped, it was still 2-3 times higher compared with the normal time. The unemployment rate of Manufacturing peaked at 13.2% and returned to its normal level at 4.7%in Januany 2021.
Table1: Estimation results of the DID model

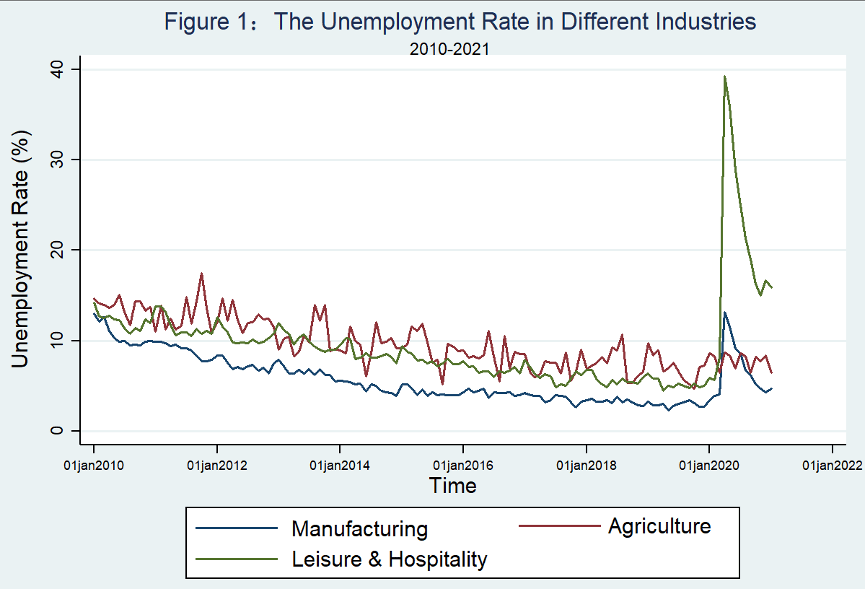
Table 1 presents the estimated results of the DID model. Before the intervention (lockdown), the unemployment rate of Manufacturing was the lowest, and that of Agriculture was the highest. The impacts of COVID-19 on the 3 industries were all statistically significant, with Agriculture being the least affected(2.778 ). The influence of pandemic on Leisure & Hospitality is the biggest which equals 18.622, 9 times as much as that on the Agriculture industry.
Unemployment Rate by Age

Figure 2 presents the unemployment rate among different age groups. The unemployment rate of all age groups gradually decreased and then became steady before the pandemic. However, when the COVID-19 broke out in March 2020, the unemployment rate became significantly higher and peaked in April 2020, where the unemployment rate for people aged 16-24 was 27.4%, almost three times than before. People aged 25-54 and 55 years old and over experienced relatively lower levels of unemployment at around 14%. In the latter half year of 2020, the unemployment rate dropped but is still higher than the pre-pandemic level.
Before the pandemic, the unemployment rate decreased with the increase in age (Table 1). The COVID-19 had statistically significant effects on the unemployment rate of all three age groups. Among these 3 age groups, the impact on the group aged 16-24 years old is the biggest, which was 9.233 (almost 2 times of the other two groups). This implies that young people have been drastically affected by COVID-19.
Unemployment Rate by Gender
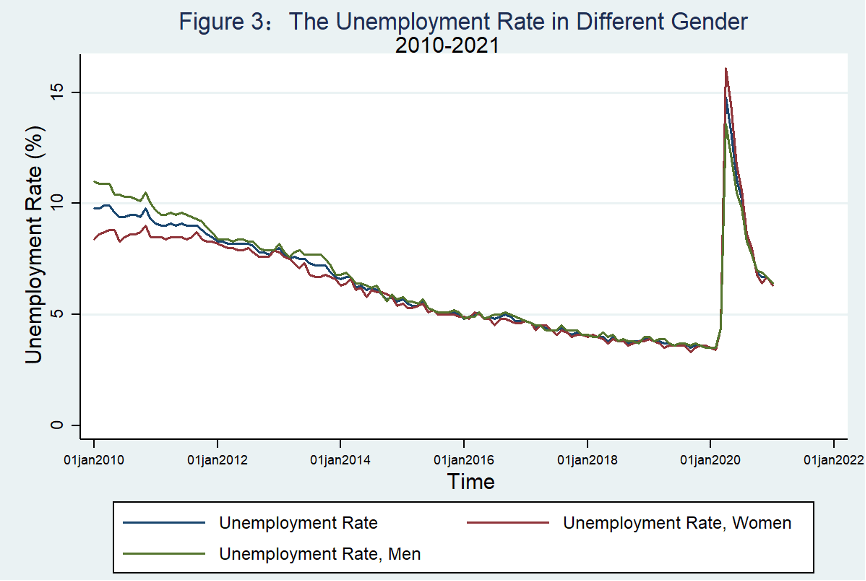
Figure 3 presents the unemployment rate among different genders. In general, the unemployment rate was stable before the pandemic. During COVID-19, the unemployment rate of both females and males increased significantly. Specifically, the unemployment rate of women reached 16.1% in April 2020, and that of men hit 13.6%.
The unemployment rate of females was less than that of males before the pandemic (Table 1). Both men and women are severely affected by COVID-19. However, the impact of COVID-19 on females (6.422) is bigger than that of males (5.622), indicating COVID-19 has a greater impact on female employment.
Unemployment Rate by Race
Figure 4 shows the unemployment rate of different racial groups. Before the outbreak of the epidemic, the unemployment rate of the four racial groups had a downward trend. Among the four groups, Black/African American had the highest level of unemployment rate, followed by Hispanic/Latino American, White American, and Asian American. After the outbreak of COVID-19, the unemployment rate of the four racial groups rose sharply. In April 2020, the unemployment rate of Hispanic/Latino American soared to 18.9%, followed by Black/African American and Asian American, with unemployment rates reaching 16.7% and 14.5%, respectively. In the middle and late 2020, the unemployment rate of the four groups was gradually falling, but still higher than their pre-pandemic level.
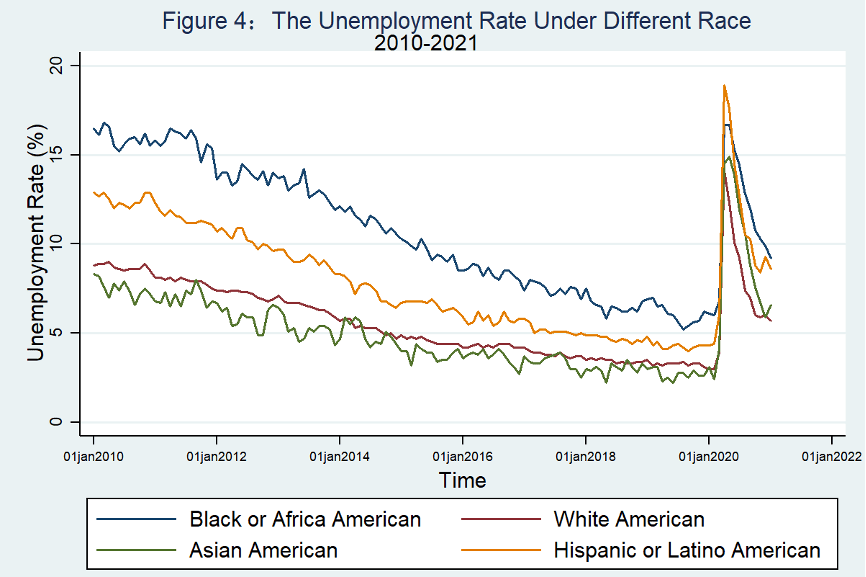
Table 1 reports the estimation results of the DID model. All groups have been significantly affected by the pandemic. The impact on group Black or African American is 7.889, which is the biggest among these 4 groups, while the impact on group White American is the smallest (=5.433). This implies Black or African American is the most affected racial group, and White American is the least affected.
Unemployment Rate by Level of Education
Figure 5 reports the unemployment rate among populations of different education levels. There is a clear trend indicating the unemployment rate is inversely related to the level of education regardless of COVID-19. Before the outbreak of COVID-19, it could be seen that the population with Less than a High School Diploma had the highest unemployment rate, followed by High School Graduates, Some College or Associated Degree, and Bachelor’s Degree and Higher. The unemployment rates of all groups began to increase gradually since 2020, all reaching the highest point in April 2020. We find that by comparing the population with the highest level of education to the population with the lowest level of education, the population with Less Than a High School Diploma (21%) is 12.6% higher in the unemployment rate than those with Bachelor’s Degree and Higher (8.4%). Similarly, as the unemployment rate of all groups decreased after April 2020, the inverse correlation between education level and the unemployment rate continued.
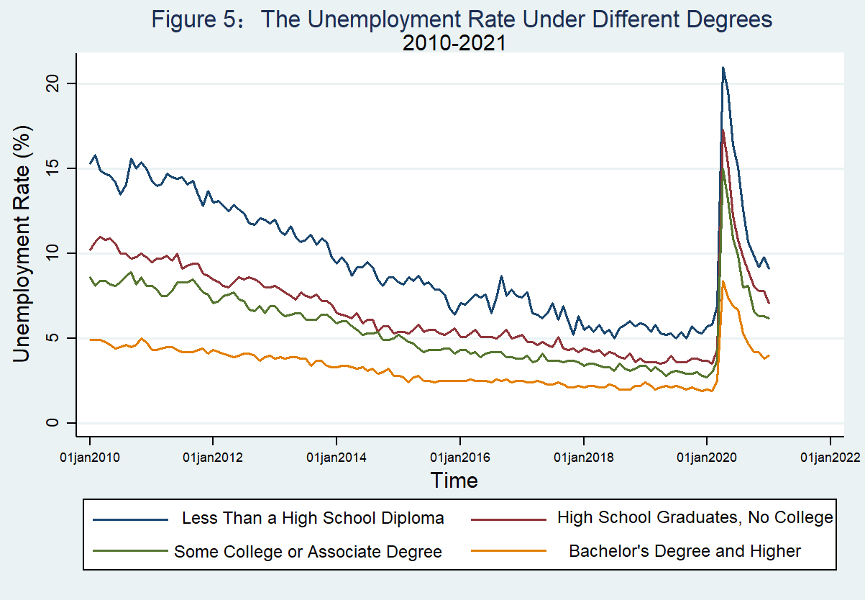
Before the pandemic, the unemployment rate decreased with the increase in education (Table 1). All groups were influenced by the pandemic and the effects were all statistically significant at 1% level. Among the 4 groups, the impact on the group with Less than High School Diploma was the greatest (9.056). Comparatively, the impact on the group with Bachelor’s degree or Higher was the lowest (3.722). In general, the impact of COVID-19 on the unemployment rate decreased with the increase in education.
Discussion and Conclusion
COVID-19 has triggered a sharp contraction for the U.S. economy and drastically affected the U.S. labor market. In this research, we showed that COVID-19 has a statistically significant positive impact on the unemployment rate of different industries, gender, race, and level of education. These findings also have implications for us to understand why different industries suffered differently during the pandemic.
The unemployment rate difference between the 4 industries may come from their different age composition. The analysis above shows that before the COVID-19, the unemployment rate is inversely related to age; during the COVID-19, the youngest group is particularly influenced by this pandemic. According to the 2017 Census of Agriculture, the average age of farm producers is 57.5 years, higher than that of 2012 (USDA 2017). The data from the Current Population Survey shows that employees in Leisure and Hospitality are much younger than those in other industries (Current Population Survey 2019). Thus, the high unemployment rate of Leisure and Hospitality may be correlated with the younger age of workers, while the average age of farmers being elder can be correlated with the unemployment rate of Agriculture tending to level off during the pandemic.
Gender may also contribute to the unemployment rate difference among the 4 industries. Previous analysis has shown that the unemployment rate of females was lower than that of males before the outbreak of COVID-19. However, after COVID-19, more females became unemployed. The DID model indicated that females are affected more by COVID-19 (Table 1). According to BLS data, the Women-Employees-To-All-Employees ratio in the Manufacturing industry, Agricultural industry, and Leisure & Hospitality industry were 29.5%, 27.7%, and 50.4% respectively in 2020 (BLS2020). This may imply that another contributing factor of the high unemployment in the Leisure and Hospitality industry is gender since the Women-Employees-To-All-Employees ratio is the highest in Leisure & Hospitality. In addition, gender seems unlikely to be the primary reason behind the difference in unemployment rates between Agriculture and Manufacturing industries, as the Women-Employees-To-All-Employees ratio is almost the same for these two industries.
Education may also contribute to the unemployment rate difference among the 4 industries. Each industry is composed of occupations with distinctive entry education requirements that heavily depend on the industry’s economic performance. According to the most recent National Agricultural Workers Survey, the average level of formal education completed by agriculture workers is eighth grade, corresponding to the Less than High School Diploma category in our model (National Farm Worker Ministry 2020). As for the Manufacturing industry, BLS suggests that 62% of the Employees were in occupations that require High School Diploma (BLS2017). Our DID model estimates show that the unemployment rate is inversely related to the level of education, so the low entry education level for most occupations in Agriculture and Manufacturing industries indicates education level could be a crucial factor leading to the unemployment rate increase in these two industries. As for the Leisure and Hospitality industry, the majority of jobs requires postsecondary education level entry, with 35% of occupation requiring Bachelor’s degree, 20% requiring Some College or Associate’s degree, and only 30% not requiring education beyond High School Diploma (Georgetown University Center on Education and the Workforce 2020). Therefore, the increase in unemployment rate of the the Leisure and Hospitality industry, being the most affected industry under COVID-19, could only be partially attributed to the low entry education requirement.
Race may also play a role in the unemployment rate difference across the 4 industries. There are 2.8%, 10.3%, and 12.7% of Black/African American employees in Agriculture, Manufacturing, and Leisure & Hospitality respectively (BLS2020). Our DID model estimates show that the unemployment rate of Black/African American is severely affected by the epidemic. Thus, the high unemployment rate of Leisure & Hospitality industry during the pandemic could be correlated with the highest proportion of Black or African American employees in this industry.
In general, this research suggests that the unemployment rate of different industries has been disproportionately affected by ethnic groups, women, younger workers, and workers of lower levels of education.
References
FEDERAL RESERVE BANK OF ST.LOUIS. Unemployment Rate-Leisure and Hospitality, Private Wage and Salary Workers
GEORGETOWN UNIVERSITY Center on Education and the Workforce. (2020, May 07)). Recovery: Job growth and education requirements through 2020. https://cew.georgetown.edu/cew-reports/recovery-job-growth-and-education-requirements-through-2020/
IPUMS-CPS. (2019). Current Population Survey—Annual Social and Economic Supplement (CPS-ASEC) (2017-2019), University of Minnesota.
National Farm Worker MINISTRY. (2020) Education. Retrieved from http://nfwm.org/farm-workers/farm-worker-issues/education/
United States Department of Agriculture. (2017). 2017 Census of Agriculture. National Agricultural Statistics Service.
U.S. Bureau of Labor Statistics. (2020). Household Data Annual Averages 18. Employed persons by detailed industry, sex, race, and Hispanic or Latino ethnicity.
Watson, A. L. (2017, September). Employment trends by typical entry-level education requirement. Retrieved from https://www.bls.gov/opub/mlr/2017/article/pdf/employment-trends-by-typical-entry-level-education-requirement.pdf

That’s soooo great!!!
LikeLike