

By Zixuan Tang, Wenxiang Diao, Yujia Guo and Yucheng Qin
From the end of the year of 2019 till nowadays, the COVID-19 epidemic has been a serious problem worldwide among these several months. Developing countries like China, India, and Russia as well as developed countries like America, England, and France all suffered a lot from this tough time. The tremendous economic damage has been caused and millions of people lost their jobs as a result of the influence the epidemic made. Not only different governments but also international organizations like WTO face difficulties to deal with the negative impact on different domains like economics, journalism, and international trades. During this disaster, hotels also faced risks or dangers to properly continue and make profits since they are closely related to lots of other domains including tourism. In this essay, we will discuss how the serious impact of the epidemic caused damages to stable hotel economics. We will focus on statistics of all the hotels in the United States by using Logger to estimate how much influence the epidemic has caused to the hotel business by comparing the same statistics and data in both 2019 and 2020.
Data and Empirical strategy
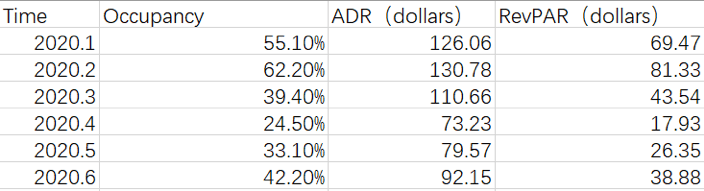
The data used in the paper covers the occupancy, ADR (Average daily rate) and Rev PAR (Revenue Pre average room) of all the American hotels in April, May and June in 2019 and from January to June in 2020, collected by STR. Data 1 shows occupancy, ADR and Rev PAR of January to June in 2020. Data 2 shows the occupancy, ADR and Rev PAR of April, May and June in 2019 and 2020. Data 3 shows the reduction rate of occupancy, ADR and Rev PAR from 2019 to 2020.
Data 1
Data 2

Data 3

We involve reduction rate to show the extent of decreases and four variables as explanatory variables: occupancy, ADR (Average daily rate), and Rev PAR (Revenue Pre average room).
We enter these statistics into Logger and obtain several graphs. In each graph, we also involve the best-fit line and calculate the formula of each line.
Graph and Interpretation
Graph1 refers to data1(only about occupancy rate)
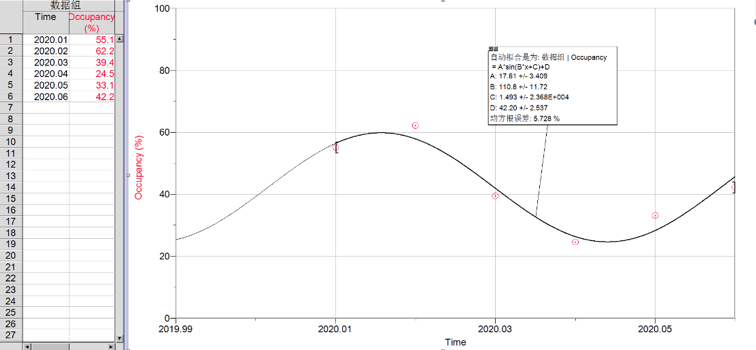
The best-fit line is a curve. From the graph, it is apparent that the occupancy rate is increasing during January and February. However, during February and March, there is about 22.80% of the decline of the occupancy rate, which is nearly half of the occupancy rate compares to the former one. This is probably because of the sudden surge of the US population of the infected COVID-19 epidemic. On the other hand, after people found that the case of this epidemic on 1/17 (it is not the first case) the United States further restricted international airports in order to prevent the spread of the virus, which is a huge shock to tourism. Therefore, the whole occupancy rate of the hotels throughout the whole United States decreased simultaneously. Later, the reduction in occupancy rate has lasted for almost one month, and finally, it increased in May with the valid control of such kind of epidemic. As people got better knowledge about this epidemic, the occupancy rate of the hotels in the United States rebounded and the situation gradually turned good as well.
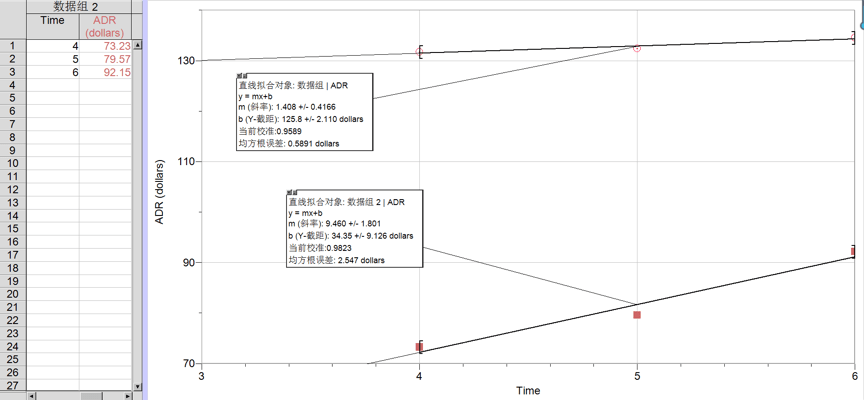
Graph 2, 3 and 4 refer to data
Graph 2

Graph 3
Graph 4
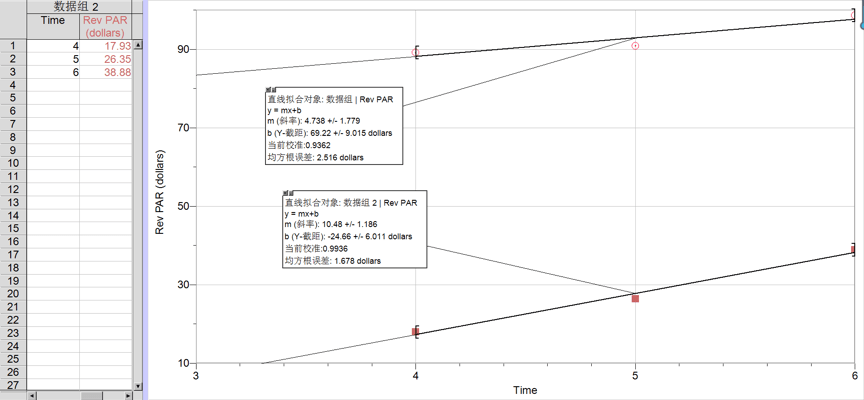
At the same time, these three graphs show the rapid decline of the hotel industry in the United States after a simultaneous decline in various indicators from January to March. The U.S. hotel industry continued to rise from April to June. This is not only a remarkable recovery and growth but also a sign that the decline in the hotel industry has stopped, a boon for the hotel industry in the United States and around the world. And instrument peak, however, seems to be in the hotel industry has had the very big temper and progress, but compared with last year, at the same time, there is still a large gap, and the data contrast can be found in the excel spreadsheet, obviously, 2020 April to June with the same period of 2019 years of data comparing, completely in a backward state, and differ a lot. In the first graph, the occupancy rate for 2019 reached 73.4% in June, while in the other two graphs, the increasing trend is similar. It can be seen that even though the overall data from April to June in 2020 has gradually improved and the declining trend has weakened, the rate of decline has slowed down significantly or even increased somewhat. All of the key metrics that measure prosperity — whether in recession or recovery — are significantly different in 2020 than they were in 2019.
Results and conclusion
In a nutshell, the new coronavirus that has caused a huge problem worldwide has caused serious damage to the hotel’s economy. As for the statistics of all the hotels in the United States that we focused on in our paper, the U.S. occupancy rate has shown a significant decline due to the epidemic in January to April in 2020 and a gradual increase from May to June in 2020. Besides, “ADR” which an indicator widely used in the hotel industry has been declining during the epidemic until the later control of the epidemic has failed to return to the original. And “RevPAR” which is an indicator used to measure hotel performance, showed an upward trend when the beginning of new coronavirus, but then the new coronavirus become less serious that the price-earnings ratio fell by nearly half in just one month which means that for occupancy rate and “ADR”, The “RevPAR” should be the biggest influence object.
